Monitoring Change Using the Climate Atlas of Canada

Photo by: Learning for a Sustainable Future (Nov 2018)

This inquiry closely aligns with the previous inquiry, Where are we now? It focuses on the importance of monitoring change and focuses predominantly on the interactive website the Climate Atlas of Canada. The use of this site will enable students to research past, present and future climate impacts in their communities under different emission pathways. From a psychological and educational standpoint, investigating climate change from a regional scale is preferred because 1) planning for and adapting to climate impacts is often undertaken at a city/municipal/community level, 2) students can engage directly with local experts and 3) this ensures learning is in alignment with the scale of jurisdictional response and in alignment with students’ locus of control. After exploring climate change impact projects, students can develop Action Projects that focus on mitigating or adapting to climate risks.

In this inquiry, students can explore tools and resources that help determine where we are now in terms of climate change, research big idea questions, consult with local political leaders or municipal planners, and visually map their understanding through concept mapping to explore different dimensions of climate change. They can also explore consensus on climate change, mitigation and adaptation, and policy analysis.

Monitoring change is an integral part of each theme discussed throughout this guide. Changes are happening faster than we can track when it comes to climate, climate science, impacts on human health, policy, regulations and technology. Therefore, the central theme of this inquiry is empowering your students with the tools and skills necessary to conduct accurate and relevant research in order to effectively monitor the changing climate and changing world around them. 

In Canada, mitigation of anthropogenic climate change and global warming is being addressed more seriously than ever before. In the 2015 election, the federal leadership made climate change a top priority and pledged actions based on the best scientific evidence and advice. 

Using recent advancements in technology such as GIS and satellite monitoring, scientists can track climate change. This also allows scientists to narrow in and see the current and projected trends in specific areas and how these will affect our day-to-day lives.

Note: How to Navigate Climate Atlas of Canada: See handout here

Within this inquiry, students will become very familiar with the Climate Atlas of Canada. Up until recently, it has been difficult to find student-friendly websites and modelling tools to show the effects of climate change across all categories (rainfall, temperature, growing season, etc.) over time. By allowing students to focus locally and continuing to foster that connection, they can bring the issue of climate change closer to home before looking into specific effects in the upcoming inquiries. Often, it is only when we see the statistics or numbers to support certain claims that we truly see the reality of an issue. 

With the Climate Atlas allowing students to look at “More or Less” Climate Change (more or less carbon emissions), they can see the results visually on a map or by looking at the data, making the issue more real than ever before. After using the Climate Atlas Map and recording the climate variables and discussing their findings, in groups, students are asked to graph the top variables to be put on display for the school to share the impacts in an engaging way.

To finish the inquiry and to continue moving forward in partnership with the community, a class trip to a local conservation area is encouraged to allow students to: 

  • see how local groups are monitoring the effects and trends of climate change 
  • see their concerns with the patterns they have noticed and 
  • have an opportunity to use some of the sampling apparatus themselves and contribute to data collection initiatives

The following three videos from the Climate Atlas of Canada can be used to hook students’ interest. They give students an opportunity to begin connecting how climate monitoring can not only give us useful information about local climate trends and predictions, but how we can use that information to our benefit. It also allows them to see the extreme effects that will take place if we do not act now and alter our lifestyles to keep our global temperature increase below 1.5 degrees Celsius. 

  • Climate modelling [Climate Atlas Canada]: 3:21 minutes Dominique Paquin of Ouranos specializes in climate data. In this video she breaks down the different parts of a model and explains how her work can help us understand and prepare for the future.

  • Dendroclimatology and the Canadian Prairies [Climate Atlas Canada]: 4:39 minutes Dave Sauchyn is a dendroclimatologist who studies tree rings to learn about climate trends in history and what that might mean looking forward. His research shows that climate change is increasing the risk of droughts that are both severe and for extended periods of time, creating somewhat of a “new normal” for the Canadian prairies.

  • Roy McLaren, Lifetime farmer observing changes to farming industry [Climate Atlas Canada]: 4:30 minutes  Roy McLaren has farmed in southwest Manitoba for most of his life. In this video he is concerned looking at maps of climate projections. “That is pretty bad,” he says, looking at maps showing a huge increase in very hot weather. “With that kind of heat,” McLaren muses, “we’d have to change our farming methods. We’d have to adopt new crops.”

Use the Bloom’s Taxonomy – Question Starters to generate higher order thinking questions. As a group or individually, students can generate their own questions using the prompts for each of the six Bloom’s Taxonomy levels: remembering, understanding, applying, analyzing, evaluating, creating. To access a pdf of the question starters click this link

Here are some sample questions to guide this inquiry using the six categories:

  1. Remembering: Have you been able to see the impacts of climate change in your lifetime, specifically with the weather and climate patterns and trends?
  2. Understanding: How can climate modelling help us at a local level? 
  3. Applying: How would you change the way we currently hear about climate change in the media?
  4. Analyzing: Why should we rely on climate modelling?
  5. Evaluating: Can we trust climate monitoring tools and climate modelling? Why or why not? 
  6. Creating: How would you generate a plan to mobilize the knowledge you leaned so that others can benefit? 

Resources for information on climate modelling in Canada:

The Government of Canada monitors changes through a program called the Climate Trends and Variations Bulletin.

Carousel Brainstorm

Engage in a brainstorm and create a list examining how “Climate Modelling” is helpful for monitoring change. This can include different sectors that are or will be impacted and how to prioritize adaptation planning based on these shifts. You can do a whole class brainstorm if time is an issue, but to encourage active participation from all students, you can use a Carousel Brainstorm technique that includes movement, discussion and reflection. With this strategy the teacher posts 4–5 large sheets of chart paper around the room, each with a different question or statement on how “Climate Modelling” is helpful for monitoring change. Students work in small groups and move from one station to another together, adding responses to each chart paper as they go. In the end, the class will have generated a list of ideas for each topic, that can be further discussed.


Ask students to reflect on their current understanding of climate change, climate modelling, and the importance of data tracking and monitoring changes as it pertains to climate change by using three simple statements to answer some or any of the guiding questions. 

  • I was thinking…
  • I’ve noticed…
  • I’ve heard… 

These simple statements can be kept in a journal to refer to as the inquiry and learning progress, or students can share with a partner or group to provoke a thoughtful discussion. Teachers should take an opportunity to read students’ thoughts to gain insight into student understanding.

The following activities are designed to structure and guide students as they pursue learning within the Climate Atlas and gain skills and knowledge as it pertains to monitoring changes to the climate. 

  1. Climate Atlas Open Exploration
  2. Mapping and graphing local data

Activity 1: Climate Atlas Open Exploration 

With the Climate Atlas, students will have the opportunity to explore a variety of scenarios. You can model for your students how to examine different variables (such as very hot days >30℃, tropical nights, cold weather, precipitation, or agriculture), through various emission pathways (i.e. different predictions for the concentration of GHGs in the atmosphere over time), and at different time periods (recent past, 2021-2050, 2051-2080). Through the “find local data” section of the website, all these variable options are available. Give students a fair amount of time to really dive into the website and test several combined variables and scenarios. Ask students to take a few minutes to examine the region that your school is located, but ultimately, students can focus on any geographic region that is meaningful or of interest to them. 

This guidebook provides an overview on the basics of using the Climate Atlas, using the map, downloading local data, and interpreting climate data. 

Students can organize data into an infographic by choosing three variables and looking at changes over two emission scenarios.

Here is a student example:

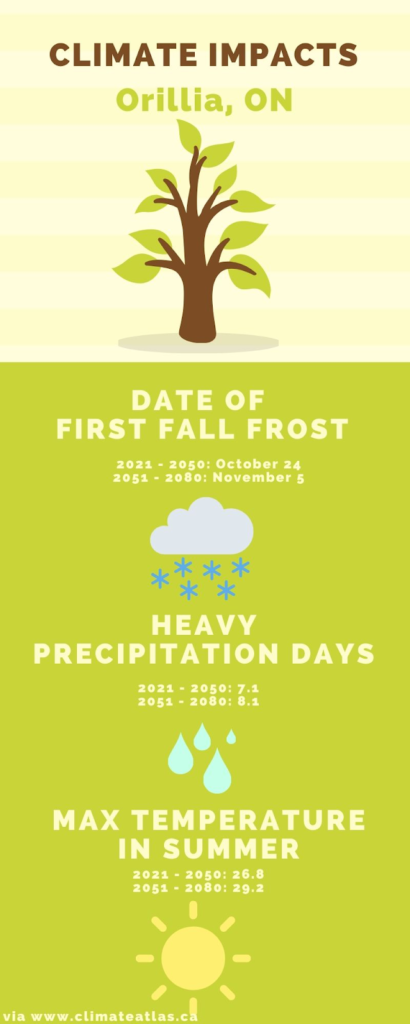
Photo: Lakehead university student infographic

After exploring the Climate Atlas, students will recognize immediately that the effects of climate change are not the same across the country or even across one province. You may want to debrief with your students by asking consolidating questions like: Do the findings from the Climate Atlas make you think about where you want to live? Are you surprised which areas are more greatly impacted? Why or why not? 

Check here for student worksheets to guide them through exploring the Climate Atlas.

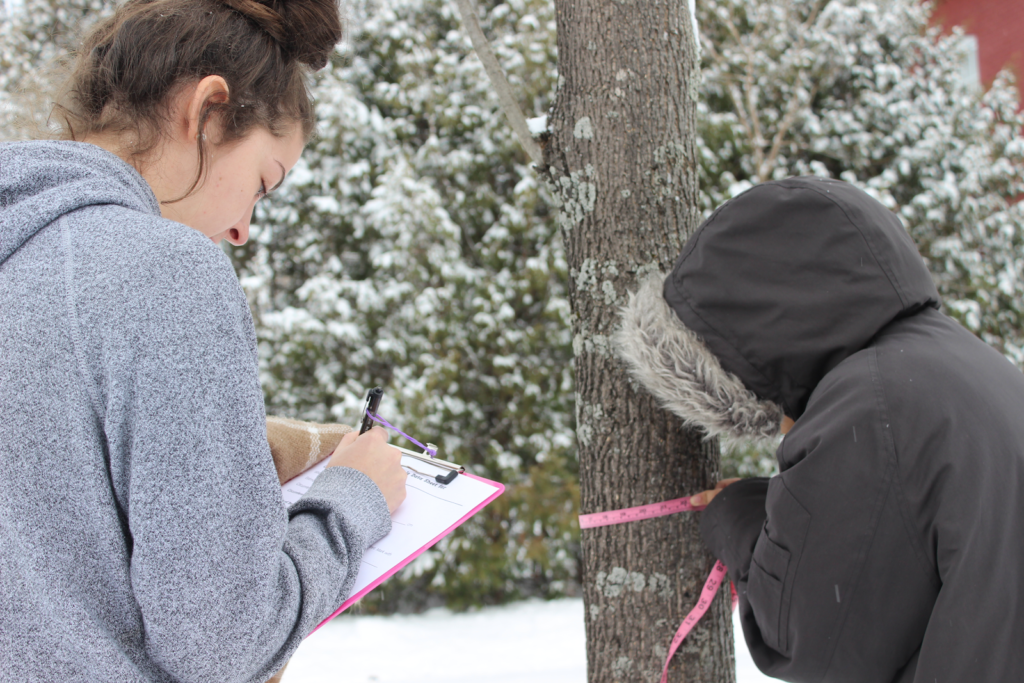
Activity 2: Mapping and graphing local data

Students should be instructed to visually represent some of the research that they conducted in Activity 1 on a map or a graph. Students can break into smaller groups (2-3 students) and discuss which information that they want to collectively graph. The visualization should depict climate change impacts on your community. Try to encourage groups to focus on diverse variables. The graph should include three time periods (recent past, 2021-2050, 2051-2080) and examine what would happen with “increased climate change” or “mitigated climate change.”

  • Note: To assist with data visualization you can view information on the page “find local data” as a time series, frequency plot, scatterplot, or climograph. Data can also be downloaded into a .csv file to use for the data management or probability explorations. 

Share your results with your school

From here, students can share their findings with the rest of their school community by putting these climate graphs on display. Students should be prepared to explain “why care.”  This is something brief that can be included on the poster to further spark a conversation for students or staff walking by. 

Extension: Invite your community to engage with the maps. 

  • The class could include an interactive piece where students walking by can ask questions on sticky notes and post them on data that they are curious about. 
  • Have “emoji like reactions beside the maps for the school community to choose to indicate how this data makes them feel. Allow other students, teachers and staff to post their reaction to the maps.

Include instructions for your community on the wall or make an announcement in the morning to draw attention and invite interaction.

After using the Climate Atlas Map and recording the climate variables and discussing, allow students to turn to a partner and then “Think, Pair, Square”. Give students a few minutes to think about the following questions on their own, then share their thoughts with a partner, and finally group with another pair to share as a group of four. 

  1. What surprised you most about the Climate Atlas Investigation? 
  2. What questions do you still have?
  3. What concerns you most about where our school community is? 
  4. Why is climate monitoring so important?

Teachers will assess learning at different points throughout the inquiry using multiple methods. The following assessment provides an alternative evaluation method to standard quizzes and tests, that can be used after consolidation or at any point in the lesson to check for understanding.  

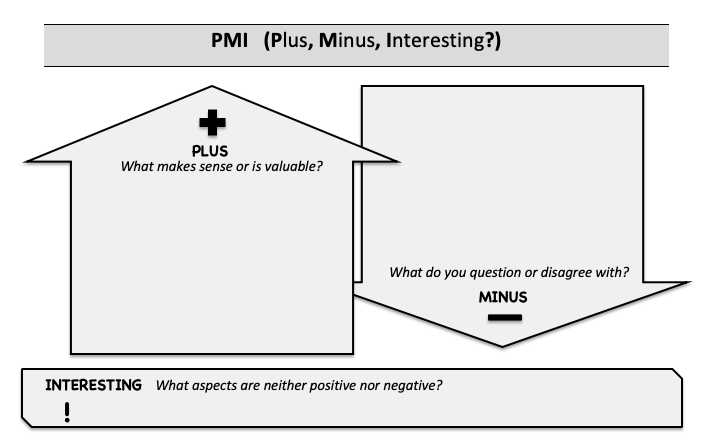
  • Plus, Minus, Interesting (PMI) Strategy – The PMI strategy is a critical thinking tool developed by Edward de Bono that allows teachers to determine student understanding of a concept. Students are instructed to write down the positives, negatives and interesting features of a topic, question or situation. PMI tool can also be used as a closure activity for students to write down the takeaway or key points of the lesson and collected by the teacher for revaluation. For more information on the PMI strategy, click here

Sample PMI organizer:


Ideas for Taking Action:

  • Citizen Science 
    • Conduct an ongoing experiment to track local changes in a specific aspect of the environment. Monitoring local changes can create a vivid first-hand account of the effect that climate change is having on the surrounding environment so close to home. This can reinforce the research that has been conducted through the Climate Atlas and provide new insights to inform action. 
  • Support Policies that support sustainability and climate change mitigation strategies
    • Research and understand current government policies and then take action by getting in touch with local government officials. For instance: write letters to local MP’s voicing concerns about environmental policies and help students learn the importance of civic action; present Climate Atlas graphs and presentations to the local council.

Action Project Examples

  • Carden Water Quality Monitoring – Patrick Fogarty Catholic Secondary School – Orillia, ON (2015)  
    • For the CAPSTONE program, students monitored the pollution that comes from cattle grazing (an essential component of maintaining alvar conditions) learning water quality measuring skills such as: temperature, turbidity, nitrogen, pH etc. They partnered with a local conservation authority and presented their findings to their city council. See their project here. 
  • Bioblitz Action Project – Rossland Summit School – Rossland, BC (2017)
    • A three-part Action Project starting at a local wetland, taking recordings and observations from the temperature to the local flora and fauna. Students applied for funding to purchase learning tools to be able to engage more deeply with the wetland and spend more time exploring. Students also educated their local community about what should and should not go down the drains to avoid algae blooms and engaged them in a huge, community-wide bioblitz to cap off their project! See their project here